

Seeing is Believing 🎚️🔉
The Design & Engineering Behind Sequence's Audio Meters

Being able to reliably monitor and adjust audio in professional multi-media creative tools is a delicate art, so creating audio meters to assist creative professionals was vital to reliably turning a professional’s creative intent into a balanced and dynamic sound mix.
Throughout the process of “dogfooding” our own app sequence.film on real video projects, we started to feel the pains of not having this. Device volume vs. media volume compete against each other IRL and meters are really the only way to ensure what you’re mixing measures the way you intend.
We decided to tackle it as an early 2025 project because it seemed simple at first glance. How complex could a colored bar animated to a sound signal be?
Like all projects we take on at sequence, it’s never as simple as we expected.
Meter? I hardly know’er!
Those simple colored bars are actually fascinating translators, turning invisible sound waves into beautiful visual information that creates a reliable standard for mixing and playing audio worldwide.
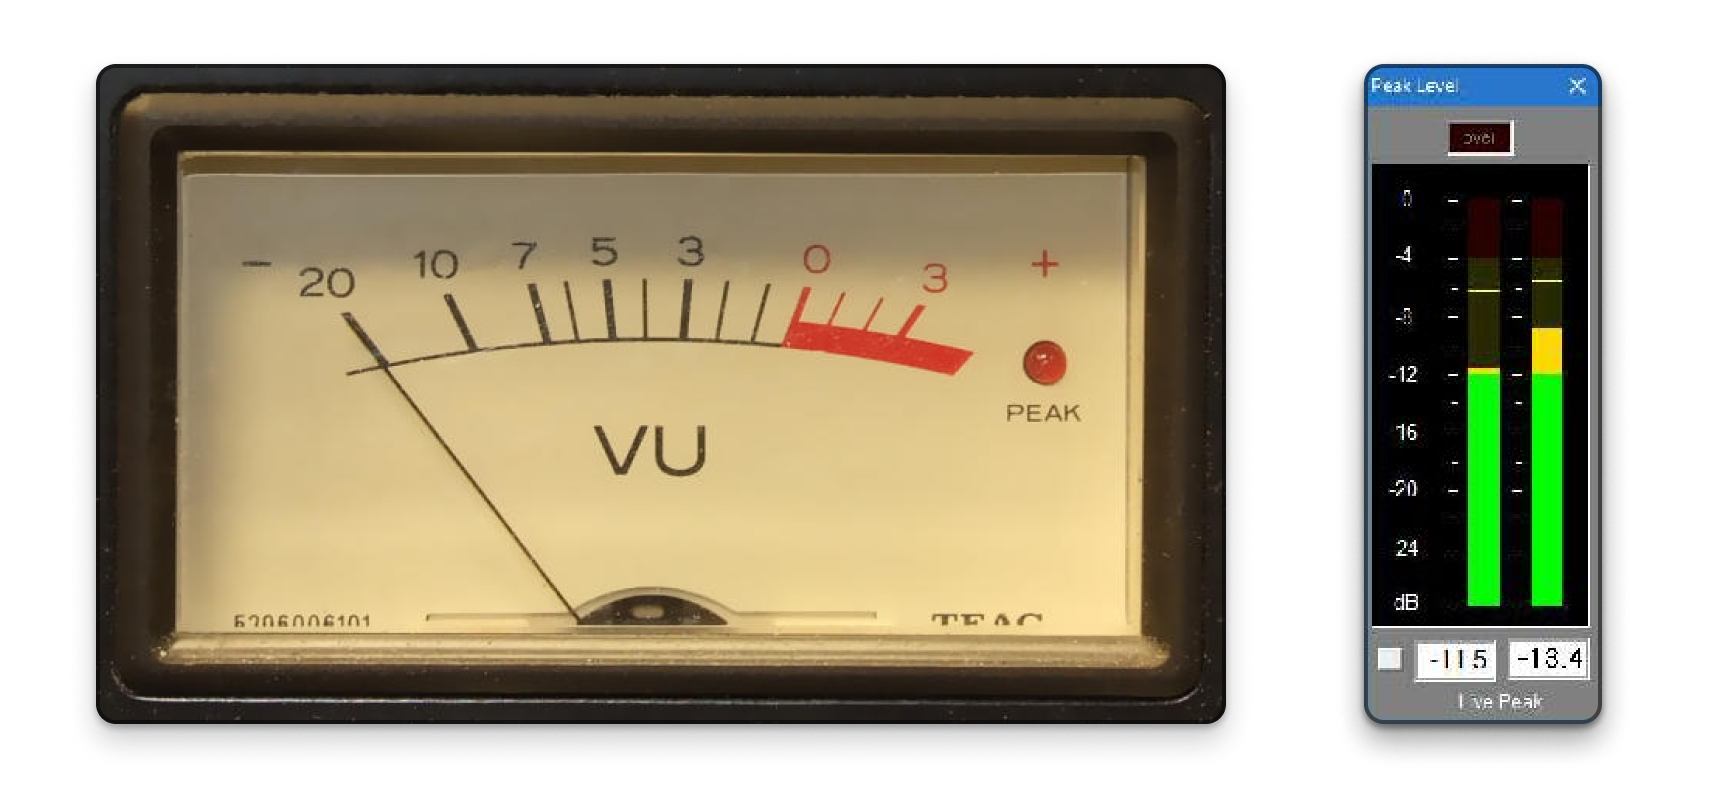
The origin of Audio Meters, like so much of the technology around us today, originates from Bell Labs. Through a partnership with CBS & NBC to try to create accurate and inexpensive equipment to help the widely expanding radio communications networks standardize their signals, they created the VU meter in 1939.
The types of meters you see across professional video and audio software today have evolved quite a bit from those analog VU meters, but the functionality and general information remains, attempting to convey three crucial insights:
They warn us when things are getting dangerous - like a speedometer creeping into red. In digital audio, we call this point “0 dBFS” - it’s where sound starts to break apart into distortion. The meters flash red, telling us to back off before the damage is done.
Then there’s the way they show us averages - how loud things feel over time rather than just sharp peaks. Analog VU meters do this naturally, with their weighted movement causing them to gently sway like grass in the wind. Digital meters need a bit more juice to help out.
Finally, they help us hit specific target audio levels. Streaming services, broadcasters, film festivals - they all have their own requirements for how loud audio should be. Good meters help us nail these standards in the authoring process rather than just clamping everything later on.
The decades between the creation of those initial meters and today has resulted in those core concepts being refined to create many different metering methods and interfaces, each optimized for specific needs:
Peak meters that catch the highest points in your audio with near-instantaneous response
VU (Volume Unit) meters that approximate how humans perceive loudness
PPM (Peak Programme Meters) that balance between peak accuracy and usability
Loudness meters that measure integrated loudness over time
True peak meters that detect intersample peaks through oversampling
…and that’s just talking about the “meters” pattern of visualizing audio!
Each type reveal different aspects of the audio signal. A good peak meter might show when you’re about to clip, while a VU meter is said to be better for balancing relative levels between tracks. Understanding these distinctions was crucial for building meters that would be genuinely useful for video editors.
Audio Metering Foundations for Video
For our audio meters, we want to work in dBFS (decibels relative to full scale) where 0 dBFS represents the maximum loudest possible digital signal level, and we are tracking measurements down to the quietest on a logarithmic decibel measurement.
This allows us to effectively translate a simple digital signal into known and agreed upon levels which are human-readable for people everywhere to share as their mixing targets:
Dialogue typically sits around -12 dBFS to -15 dBFS, with peaks not exceeding -10 dBFS
Music usually floats between -18 dBFS to -14 dBFS (depending on whether it's background music or featured music)
Sound effects range from -20 dBFS for ambient sounds up to -10 dBFS for impact moments
Room tone / background ambience hovers around -30 dBFS to -40 dBFS
The overall mix peaks around -6 dBFS, giving that crucial headroom before clipping at 0 dBFS
Trailers and promos often push louder, peaking around -4 dBFS
Feature films typically maintain wider dynamic rage, with quiet scenes dipping to -50 dBFS or lower
Of course, these aren’t rigid rules. Every project has its own sonic landscape, and the goal is for the meters to behave in a way that allows you to easily think about and mix these levels intuitively.
This is why professional audio meters can’t just be about animating the size of a line in accordance with the audio signal: the UI needs to translate the sound waves with more intention. Luckily over the decades, standards have been developed here too in forms of unique UI/animation concepts these meters ought to support, such as “meter ballistics” (awesome name), to make meters work well for humans:
Attack time: how quickly the meter responds to volume increases (faster for peaks, slower for averages)
Release/decay: how quickly it falls back down (usually more gradual than attack)
Peak hold: those little lines that hang on to the highest peak level for a duration of time so you get a chance to actually read the level
Color zones: green feels safe, yellow makes us cautious, red screams danger
Averaging windows: different spans of time to match how our ears perceive sustained sound (300ms became the sweet spot for VU meters)
Logarithmic scaling: because our ears work exponentially, not linearly
Ballistic curves: the way the meter smoothly accelerates and decelerates, almost like it has mass
Needle damping: in analog meters, the actual physical resistance to prevent bouncing (now simulated digitally)
Designing in Code

After this rabbit hole of research, I felt a lot more confident we could create some genuinely useful audio meters for video professionals. But it also became clear the traditional “design & handoff” process wouldn’t work for this.
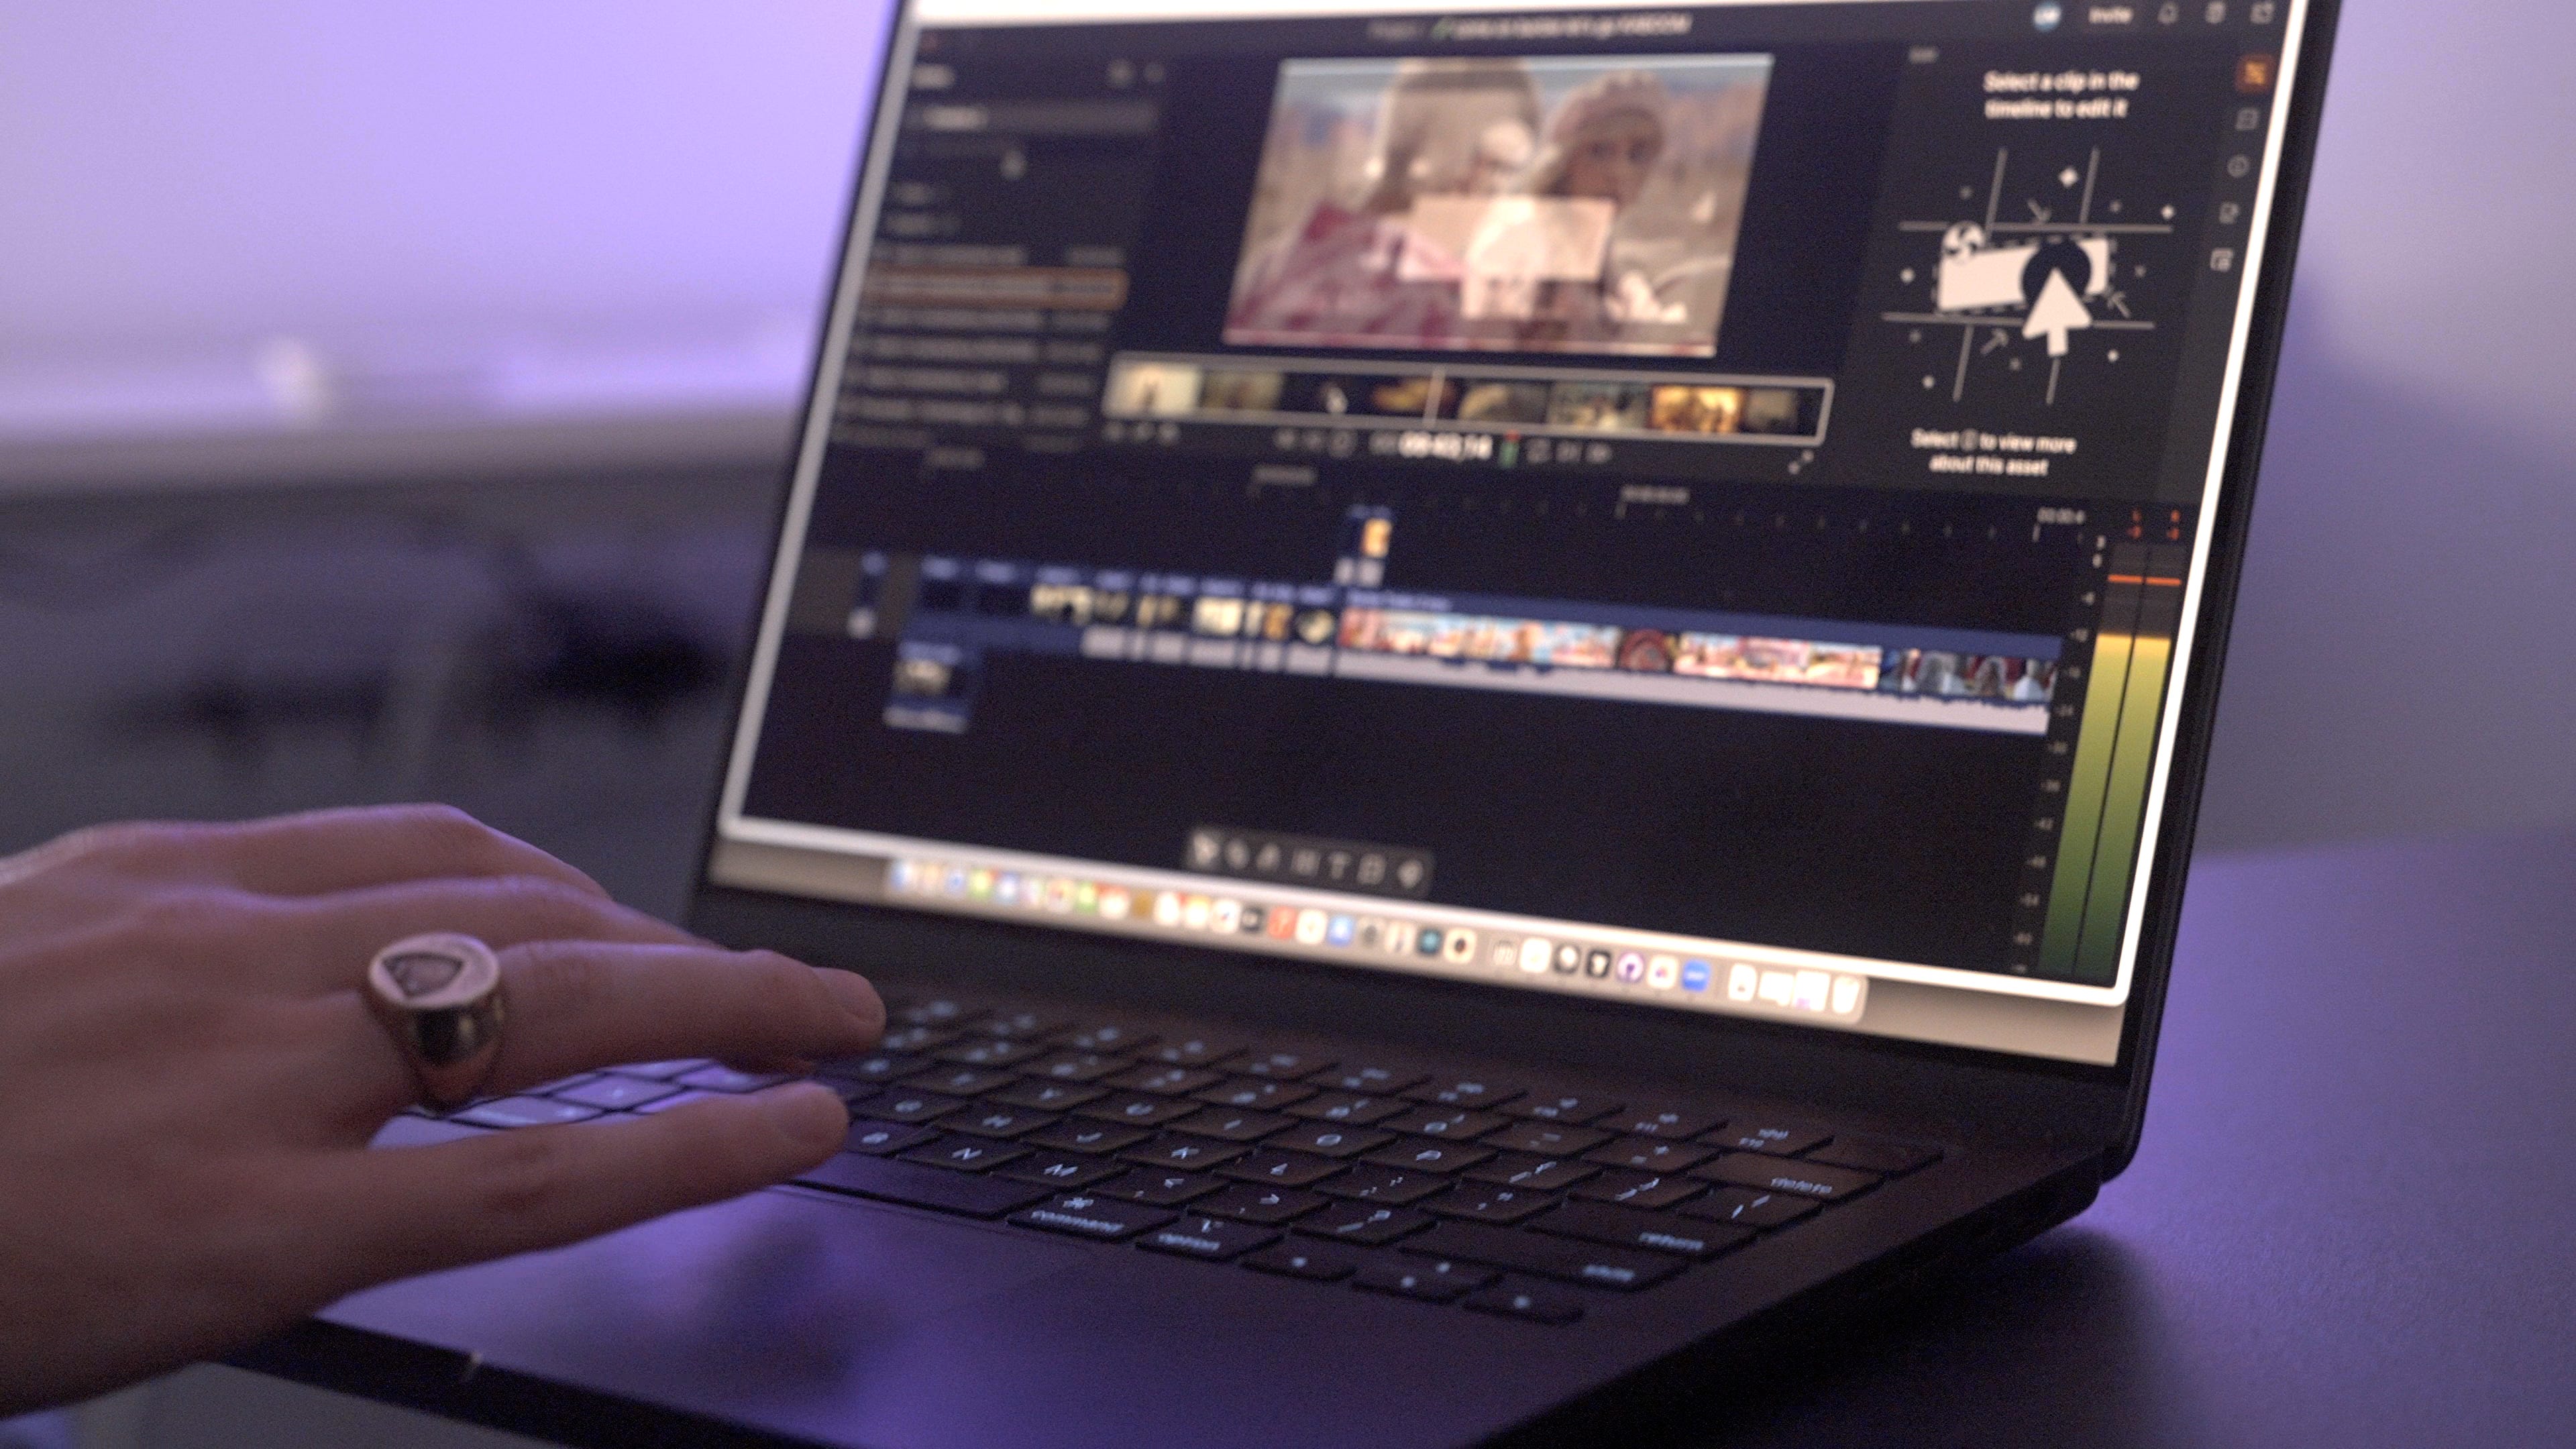
This was less about the exact pixels to draw and where to put it in the app, and more about how it felt to see the meters react over time to real audio mixes.
In order to try to understand the problem space better and get a feel for how these meters reacted with real audio, I found myself prototyping and designing the meters in code it via AI. Well, 3 times, if we’re splitting hairs.
Prototype A - Meter Madness
The first prototype was meant just for myself, and was built in a side-project codebase I use for prototyping ideas using a similar technology stack to what we use at Sequence. Working with Anthropic’s Claude Sonnet-3.5 and Cursor Composer over the course of a (very late) evening, I created a simple app that utilized the Web Audio API and its AnalyserNode to give us real-time frequency and time-domain data.
From there, I could experiment with different style treatments, settings, and test audio files to get a sense of what we wanted to do for our app.
Prototype B - Polish & Refine
While Cursor Composer is great with the type of app logic to explore technical ideas, it’s not so great with frontend exploration. For that, Vercel v0 really seems to stand out from the AI code-gen crew. So I gave the relevant parts of my initial prototype to v0 and spent a couple of hours refining the main components we were concerned with.
Working in this way, it took a few hours to get a style I was pleased with, integrate proper synchronization between the Mini Meters and the Full Meters, add responsive resizing, and even allow the meters to respond to different multichannel audio layouts. And I can even deploy + share a link directly with our team. Great work, v0!
Only catch is that v0 primarily works with Next.js, so now we have React components… (we LOVE Svelte here at sequence)
Prototype C - Once More…. in ✨Svelte🥰
Finally, feeling satisfied with the state of the prototype, I once more took the code back to Cursor Composer and re-translated it to support Sequence’s Svelte 4 + Typescript tech stack and our “Montage Design System”
From Canvas to (Post-)Production
Typically designers hand off a set of “screens” or “specs” to developers to implement features once we’ve finished designing them. At their core, these are just descriptive graphic documents, which developers still have to *write in code*.
This process of designing the actual audio meters via interactive code left me with no specs to hand off, simply the actual code (with all the complexities of interpreting a digital audio signal into dBFS and accurately animating them along with our custom ballistic and level settings) and a set of recommendations for how it should live in the app. From there, our CEO Luke picked it up and was able to integrate it into our media pipeline and polish up the interactions in just 2 days.
While we could have implemented the meters using DOM elements, we chose Canvas for rendering (just as we chose to do for our Timeline panel). This gave us precise control over the visualization while maintaining excellent performance. The basic rendering loop looks something like this:
Get current audio data from the AnalyserNode
Apply smoothing based on ballistic settings
Convert linear amplitude values to logarithmic dB scale
Draw meter bars with appropriate colors for warning/clip zones
Update peak markers and hold indicators
Schedule next frame
Small differences to timing, smoothing, or visual feedback could dramatically change how the meters felt to use. These coded prototypes using the canvas were the straightest path to ensure my design intent matched what ended up shipping in production.
Lessons for Designing Creative Tools
Through this process, we learned several key principles to take on as we continue designing the best tool for video professionals possible:
Balance precision & usability: While we could display exact dB values to multiple decimal places updating as fast as we can read the signal, good meters communicate information more subtly to keep you in the flow. By choosing a sample window and selectively choosing to show peak values instead of amplitude in the label readouts, we can make this less visually jarring.
Respect industry standards: Audio professionals have developed certain expectations about how meters should behave. Breaking these conventions without good reason only creates cognitive friction.
Design for different contexts & states: Editors need different information when recording, mixing, or doing final output. Good meters adapt to these contexts, and even consider the brightness and color of what they show during playback vs. not in playback.
Consider performance implications: Audio metering needs to be responsive without impacting playback or or editing performance. Canvas rendering and efficient data handling were crucial for achieving this.
It’s Showtime, Baby 🎟️
The final implementation in Sequence achieves several key goals:
Accurate peak and RMS level display
Smooth, natural-feeling response to audio changes
Clear visual feedback for warning and clip states
Professional-grade precision while maintaining usability
But perhaps most importantly, building these meters taught us valuable lessons about the intersection of technical precision and user experience. It’s not enough for tools to be technically accurate - they need to feel right, becoming a natural extension of the creative process. And, perhaps, we need to adapt the ways we build things to support that.
Its essential to have accurate and well designed PPMs for monitoring audio levels within the GUI but I always use an analogue PPM for the final tech review and of course as long as you do not ever alter the volume control your ears are a good guide to overall balance!